
Nefta Revenue Uplift Methodology
How Nefta measures and validates ad revenue uplift from advanced bid floor optimisation.
A/B Test Methodology
Nefta's objective is to measure the impact of bid floor optimisation as fairly and accurately as possible. This is particularly challenging for apps with lower user and impression volumes. Nefta selects the most appropriate A/B testing approach based on each app's data volume, using one of the following methods.
User-based A/B testing
Nefta's system by default assigns users permanently to control or treatment groups. This is the traditional approach in A/B testing, however can cause variance in apps with lower volumes.
Session-based A/B testing
Unlike traditional A/B tests that assign users permanently to control or treatment groups, when activated, Nefta assigns groups per user session. A single user may therefore have one session with optimisation and another without. This approach reduces variance and prevents a small number of exceptionally high-value users ("whales") from disproportionately affecting the results. This is important for apps with lower volumes.
A/B Testing Approaches & Integration Options
Options 1 & 2, Init Nefta for 100% of users:
The recommended approach is to start with a publisher-managed A/B test to validate performance, then transition to a smaller, always-on holdout managed by the publisher or Nefta. Alternatively, publishers can let Nefta manage the A/B test from the outset which is important for lower volume apps.
Both approaches compare the performance of Nefta bid floor optimization against your existing ad setup.
Publishers can record the Nefta optimisation status on init to ensure data parity between Nefta and the publisher’s analytics.
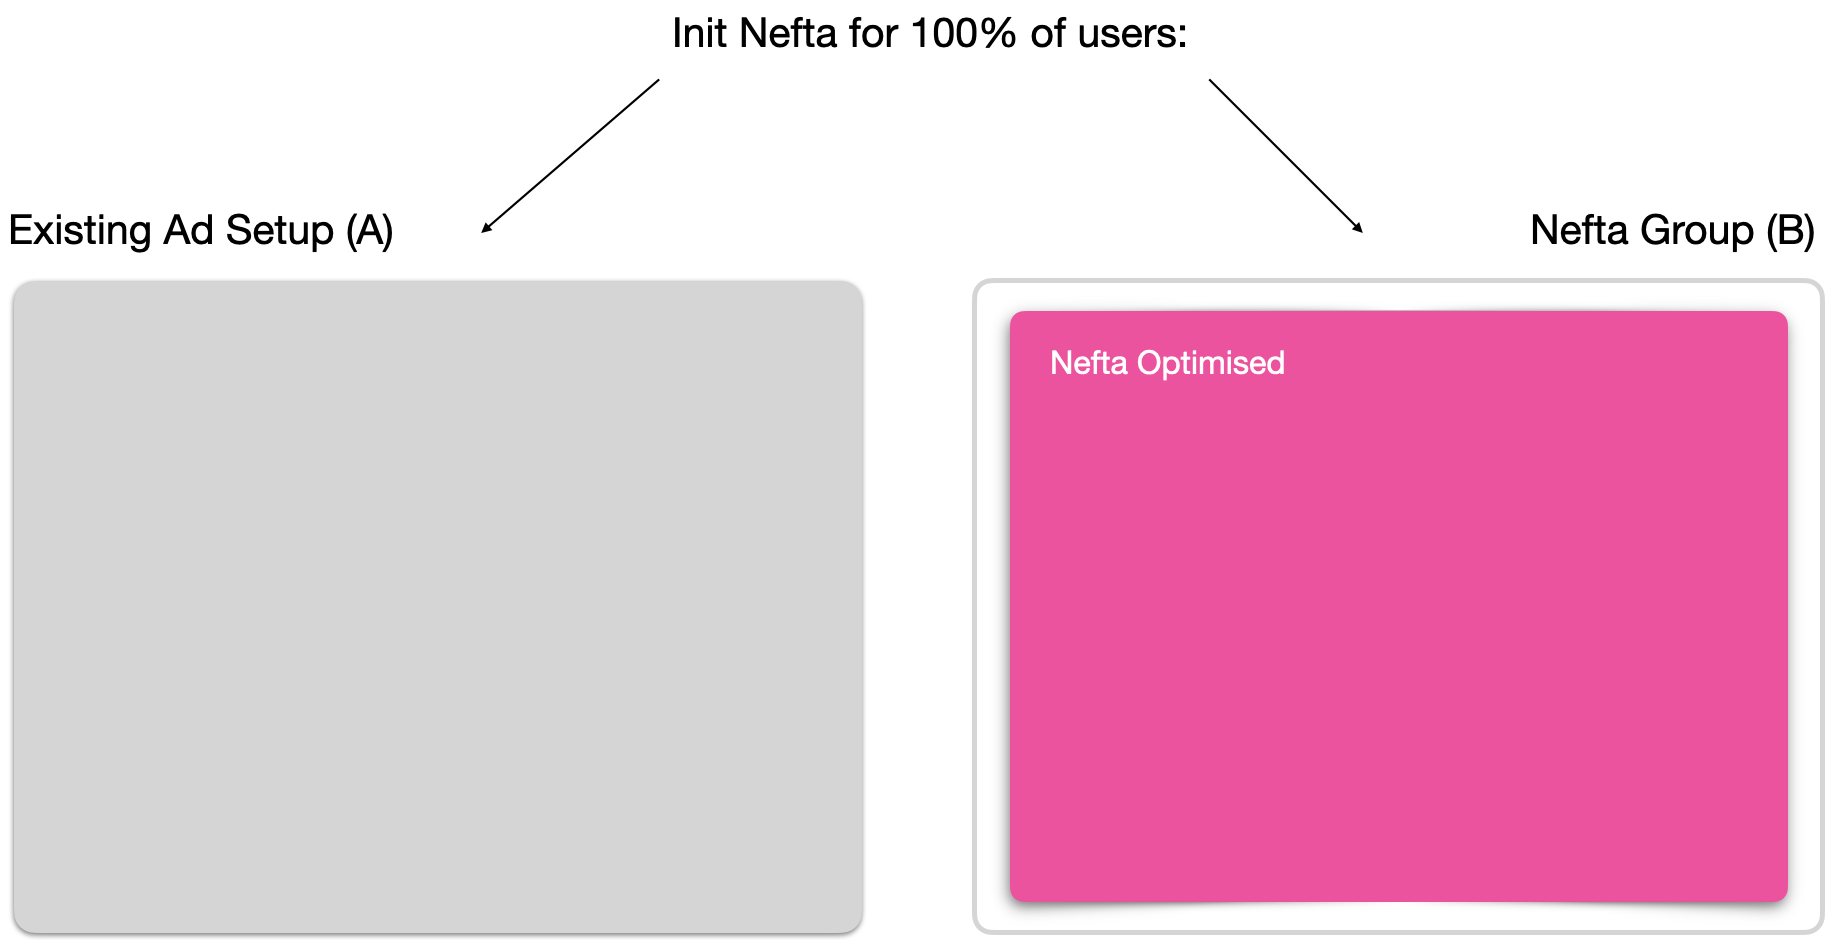
(Figure 1: Clients can compare their existing ad setup against Nefta's bid floor optimisation where both parties see the same thing)
Option 3, Init Nefta only for Experiment Group:
Run an isolated A/B test by initializing Nefta only for the experimental group. This requires no Nefta initialization for control users, but Nefta cannot obsrve the control group and must maintain its own baseline within the test group. As a result, uplift calculations and reporting may differ between Nefta and the publisher.
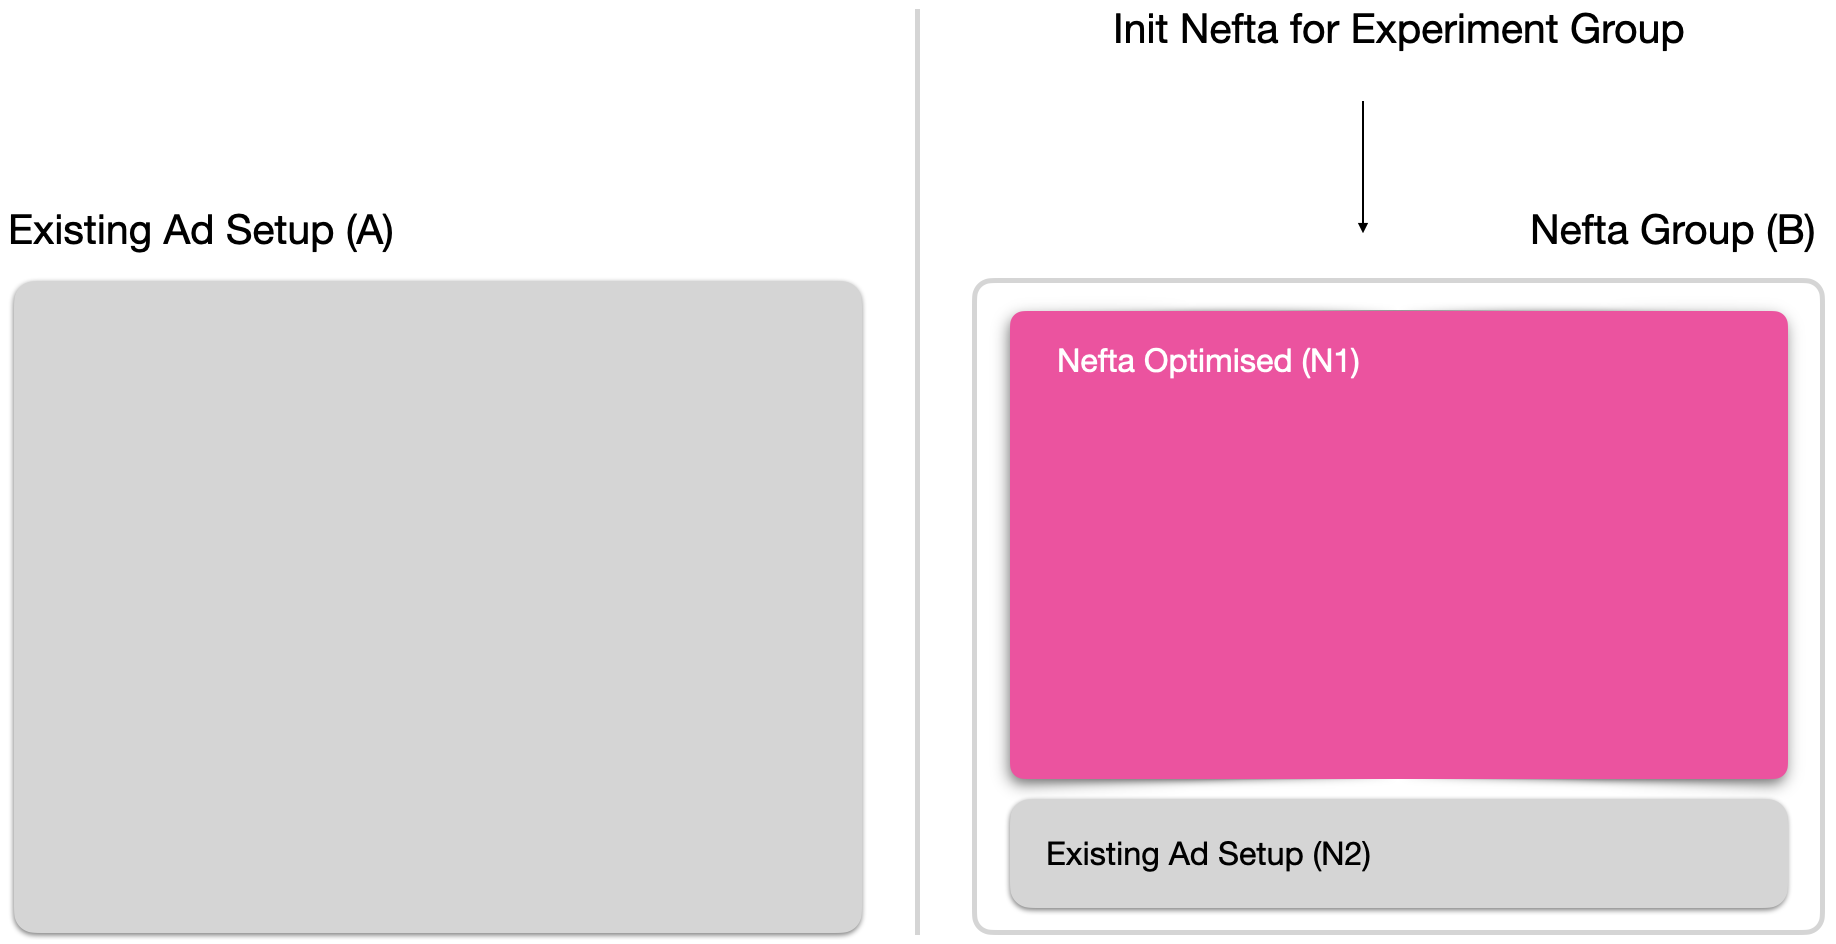
(Figure 2: Clients can compare their existing ad setup against Nefta's bid floor optimisation but there is an overlap of optimised users and the A/B tests will have a larger difference)
The full A/B testing and integration guide can be found here.
Uplift calculation
Stratified aggregation
In calculating uplift, observations are grouped into segments defined by:
date
app_id
ad_type
geo_tier
Grouping similar users together allows Nefta to compare "apples-to-apples" and improves statistical reliability.
-
Raw data: Revenue source of truth:
Nefta collects raw client side data and uses the actual impression level data callback as the source of truth for revenue. In MAX, the event is triggered from:OnAdRevenuePaidEvent -
Raw data: Aggregation to segments:
Nefta aggregates using the following segmentation:date,app_id,ad_type,geo_tier
number of control user sessions:control_sessions
number of Nefta user sessionsnefta_sessions
control revenue:control_revenue
Nefta revenue:nefta_revenue -
A/B Test: Segment Normalisation:
For each aggregated segment Nefta calculatesnormalized_control_revenuebecause the proportion of control/Nefta is different. Normally, the Nefta Control group (N2) is 5-15% of the user sessions and remaining user sessions receive the optimisation.normalized_control_revenue = control_revenue * nefta_sessions / control_sessions
This formula calculates the control revenue as it would have exactly the same volume as Nefta. -
A/B Test: Segment Uplift
The uplift for a segment is the difference:total_uplift = nefta_revenue - normalized_control_revenue
Uplift percentage is the ratiouplift = total_uplift / normalized_control_revenue -
A/B Test: Total uplift
To calculate total uplift, Nefta uses the same formula as the segment uplift, applied to the sums:total_uplift = SUM(nefta_revenue) - SUM(normalized_control_revenue)uplift = total_uplift / SUM(normalized_control_revenue)
Notes:
- Segments with insufficient data are excluded from analysis.
- Outliers are never removed.
- Variance reduction is achieved through session-level testing and stratified aggregation.
- Nefta sums revenues, not segment-level percentages.
- Segment uplift ratios are never averaged.
Nefta's "Zookeeper"
Mobile apps vary in their user behaviour, session lengths, ad frequency, geography, and monetisation patterns. An optimisation strategy that performs well for a hypercasual game may not be optimal for a hardcore title. Rather than relying on a single approach, Nefta continuously evaluates multiple bid floor optimisation algorithms in parallel and dynamically allocates traffic to the strategies performing best for each environment.
Nefta's bid floor optimisation framework contains multiple optimisation algorithms running simultaneously where traffic may be allocated between:
- Control
- Algorithm 1
- Algorithm 2
- Algorithm 3
- Additional candidate algorithms
Traffic allocation is managed using Thompson Sampling, a Bayesian multi-armed bandit approach. Rather than assigning a fixed percentage of traffic to each algorithm, Zookeeper continuously adjusts traffic allocation based on observed performance and uncertainty.
For control and each optimisation algorithm, Zookeeper compares the distribution of mean session revenue and estimates both:
- Expected revenue (mean)
- Uncertainty (standard error)
The objective is not simply to identify the algorithm with the highest average revenue, but to identify the algorithm with the highest expected revenue while accounting for uncertainty.
Statistical Confidence
The amount of overlap between two revenue distributions indicates the confidence in the performance difference.
High overlap = high uncertainty
When distributions intersect significantly, there is substantial uncertainty about which algorithm performs better. More observations are required before concluding that one algorithm is superior.
In this scenario, Zookeeper naturally allocates more traffic to competing algorithms, including the control group, in order to gather additional evidence.
The illustration below shows two distributions with considerable overlap. Although the red distribution has a higher average revenue, the overlap indicates that the difference may not yet be statistically reliable.

(Figure 3: High overlap between distributions → lower confidence)
Low overlap = high confidence
When distributions are clearly separated, there is greater confidence that one algorithm outperforms another.
In this situation, Zookeeper gradually allocates more traffic toward the superior algorithm and reduces exploration.
The illustration below shows minimal overlap between the green distribution and the control distribution, indicating strong confidence that the optimisation delivers higher session revenue.

(Figure 4: Minimal overlap between distributions → higher confidence)
Exploring New Algorithms
New optimisation algorithms begin with relatively few observations, resulting in wider revenue distributions and greater uncertainty. If a new algorithm's distribution overlaps significantly with existing algorithms, Zookeeper allocates additional traffic to gather more evidence.
As more observations are collected, uncertainty decreases and the distribution narrows. Algorithms that consistently outperform alternatives naturally receive a larger share of traffic, while weaker algorithms gradually receive fewer observations.

(Figure 5: New algorithms start with high uncertainty and receive additional observations until confidence improves.)
Adaptive Control Group Size
Unlike traditional A/B tests with fixed traffic splits, Nefta's control group size is dynamic.
If optimisation algorithms are producing inconsistent results or there is substantial uncertainty, Zookeeper automatically increases the proportion of observations allocated to the control group and competing algorithms.
Conversely, when an optimisation consistently outperforms the alternatives with high confidence, traffic is shifted away from exploration and toward the winning algorithm.
This allows Nefta to:
- Increase statistical confidence when results are uncertain.
- Reduce the risk of false positives.
- Continuously evaluate new optimisation algorithms.
- Maximise revenue while maintaining a reliable baseline.
Statistical significance is not determined solely by the number of observations. It is determined by the separation of the session revenue distributions. When distributions overlap heavily, more observations are required. When they are well separated, confidence is achieved with fewer observations. Zookeeper adapts traffic allocation accordingly.
In effect, the system continuously balances exploration (learning) and exploitation (maximising revenue), while maintaining a statistically robust control group and providing reliable measurements of uplift.
Fun fact: Nefta's optimisation algorithms are named after team members' favourite animals, giving rise to names such as Octopus, Salamander and Raven. With a growing collection of animal-themed algorithms to manage, the system responsible for distributing traffic naturally became known as "Zookeeper". 🐙🦎🐦⬛
Request for data
Raw impression-level data and aggregated data used in Nefta's uplift calculations are available on request. Clients can also be provided with dedicated Looker dashboards containing app-specific reporting and uplift metrics.
Nefta's objective is to build trust in the methodology and provide complete transparency. By giving clients access to both the underlying data and reporting tools, results can be independently analysed and validated.
___
Definition of geo_tier:
GEO_TIER_1 = ["AU", "AT", "BE", "CA", "DK", "FI", "FR", "DE", "IE", "IT", "LU", "NL", "NZ", "NO","ES","SE", "CH","GB", "US"]

GEO_TIER_2 = ["AD", "AR", "BS", "BY", "BO", "BA", "BR", "BN", "BG", "CL", "CN", "CO", "CR","HR", "CY", "CZ", "DO","EC", "EG", "EE", "FJ", "GR", "GY", "HK", "HU", "IS", "ID", "IL","JP", "KZ", "LV", "LT", "MO", "MY","MT", "MX", "ME", "MA", "NP", "OM", "PA", "PY", "PE","PH", "PL", "PT", "PR", "QA", "KR", "RO", "RU","SA", "RS", "SG", "SK", "SI", "ZA", "TH","TR", "UA", "AE", "UY", "VU"]

GEO_TIER_3 = Everything else
Updated about 3 hours ago